
We cover the basic features of the Exceptionless platform on our feature tour page, but we wanted to give everyone a deeper look into all the information available via the web-based, real-time .NET error reporting admin area.
Continue reading to learn more.
The Dashboard
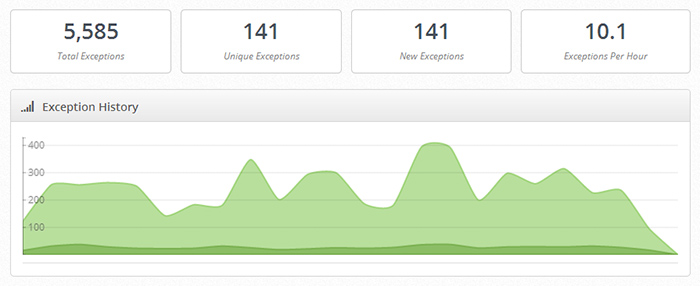
The Exceptionless Dashboard features a quick overview of the exceptions for the currently selected project. It also updates in real-time, so you can watch exceptions roll in.
This is a great place to glimpse your exceptions by total, unique, new, or per hour. The most frequent and most recent exceptions are also displayed here, along with a graph representing your total and unique exceptions. You can go directly to an error's details by clicking on it.
At the top of the page, throughout the admin, you can:
- Change the project you are currently viewing
- Go to that projects settings
- Adjust the date range
- Show/Hide hidden errors
- Show/Hide fixed errors
- Show/Hide "Not Found" errors
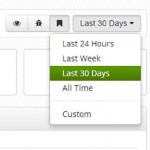 Show/Hide Errors & Select Date Range
View Most Recent, Most Frequent, and New Exceptions
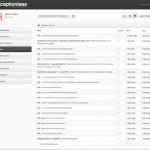
On the left side of the dashboard, you can select to view your Most Recent, Most Frequent, or New (first time) .NET exceptions.
 New Errors
Most Recent
The most recent report lists your errors individually with the one that occurred last at the top. It also tells you exactly how long ago the error occurred. You can click into the exception to view details.
Most Frequent and New Exceptions
Each of these reports lists the respective error type with a summary, the count, when the error first happened, and the last occurrence. Most frequent is ordered by count, and new is ordered by most recent.
Lets Take a Look at Exception Details
Error Stack Page
If you click into any error, Exceptionless will show you the error stack, which includes the number of occurrences, when it first happened, and the latest re-occurrence. You can adjust the date range on this page, like the rest, and you also get a nice graph of that error's occurrences over time. Each individual time the error triggered is listed below the graph, and you can click into each instance separately.
Before we do that, though, I'd like to point out another major feature of the error stack page..
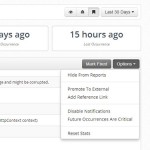
Above and to the right of the graph are two buttons: "Mark Fixed" and "Options". Mark fixed is exactly what it sounds like, and if you click on the "Options" button it drops down with the following choices:
- Hide from reports
- Promote to external
- Add reference link
- Disable notifications
- Future occurrences are critical
- Reset stats
Individual Error Details
After you click into an individual error instance, you will see the following tabs.
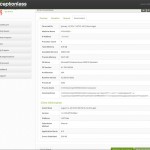
Error Overview
This page shows you a quick overview of the error, including the stack trace. It includes the date and time, type, message, platform, URL, and referrer. You can also go to the previous or next occurrence.
Exception
This tab displays a few overview details, then gives you a list of loaded modules related to the error.
Request
The request view gives you the request details, including date and time, http method, url, referrer, client IP, user agent, browser, browser OS, device, and whether or not it's a known bot. You also get Post Data.
Environment
Because you needed all the data, the environment tab displays time and date, machine name, ip address, processor count, total, available, and process memory, OS name, OS version, architecture, runtime version, process ID, process name, and command line details. It also has client information, such as install date, version, platform, submission method, application starts, and errors submitted.
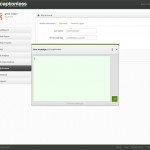
What Else Can I Do from the Admin?
Naturally, you can manager your projects, organizations, and account, but we also have pretty handy feedback and support tools so you can let us know how we're doing! Your feedback and comments are important and provide direction to the code.
In short, the tool offers extremely helpful insights into the world of your web application's bugs. Whether internal or customer-facing, knowing when, where, and how many exceptions are being generated makes it easier for you to track them down and squash them. And when you've fixed it, regression notifications are there to let you know if it rears its ugly head again.
Still not convinced? Give it a try - sign up today, for free.