We couldn't just throw in a string search and hope for the best. We had to build it in a way that let users perform basic and advanced filtering, easily, with fast and streamlined results.
Enter Exceptionless filtering and searching. You can filter by organization, project, multiple time frame selectors, and specific event variables (with modifiers).
Watch the video below for a quick test drive, and read further down the page for more details and links!
Exceptionless Filtering and Search Demo Video
Filter by Organization & Project

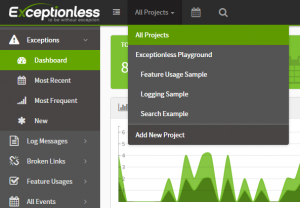
By default, the dashboard loads up with all projects selected.
To show only data from a specific organization or project within an organization, simply click on the "All Projects" drop down in the top left of the dashboard and select your organization or project.
Whatever view you are in will then be transformed to display only data from that organization/project.
To change it back to all projects, simply select the drop down again and click on "All Projects."
Filter by Time Frame

Exceptionless offers multiple preset time frame options, as well as the ability to customize the time frame down to the second.
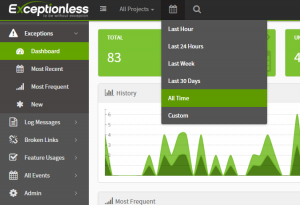
To select your time frame of choice, click on the calendar icon next to the project drop down on the top navigation bar of your dashboard.
Once there, you can select "Last Hour," "Last 24 Hours," "Last Week," "Last 30 Days," "All Time," or "Custom."
Most of these options are pretty self explanatory, but if you click on "Custom," a popup will appear that lets you select the start and end date, as well as start and end hours, minutes, and seconds of those dates.
Another way to control the data time frame is to simply select a period of time on the history graph itself by clicking, dragging, and releasing. This will automatically update the custom time frame points and refresh the data to match that period.
Filter and Search by Specific Criteria

Being able to search your errors and events by specific criteria is, perhaps, the largest improvement for version 2.0.
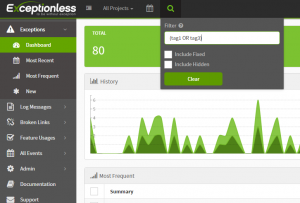
By selecting the magnifying glass icon next to the calendar icon in the top navigation, you can enter search criteria and select whether you want the results to include fixed and/or hidden events/errors.
You can filter by tag, ID, organization, project, stack, type, value, IP, architecture, user, and much much more. Some searches, such as ID, require a prefix ("id:") on the search, but others, such as error.message, can be entered as strings ("A NullReferenceException occurred"). View a complete list of searchable terms, examples, and FAQs on our Searching Documentation Page.
We're Always Improving - What Could be Better?
Please let us know what you think of the filtering and searching abilities by commenting here on the blog, sending us an in-app support message, or filling out our contact form. We're always looking for feedback, and genuinely want to know what you think!
